Hello~!
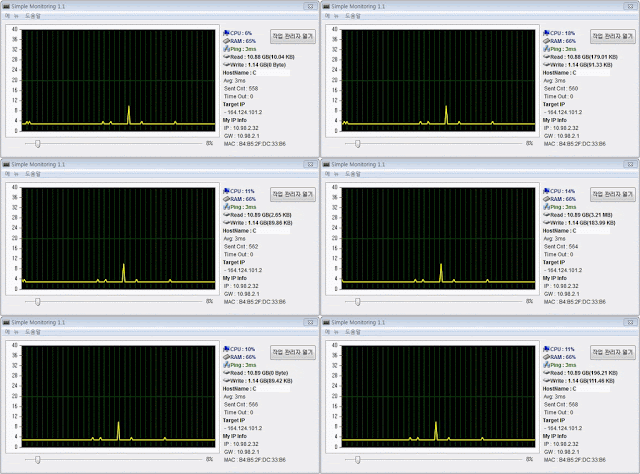
I renewed my previous monitoring program.
When monitoring CPU usage, you can see which processes have a large share.
Added features successfully. You can also detect ping delay and request time out to leave a log.
HDD read/write usage capabilities tend to be slightly more CPU-intensive (use 0 to 1 in 2 seconds)
Set "Stop" to "Stop" for users with lacs as CPU load.
Screen running.By default, the test graph is displayed. !!! ping
The default server Dacom dns the target ping. !!!
Optional settings have log settings based on CPU and memory utilization.
You can set the log according to the ping MS speed and also set the ping target address.
When logging is disabled, simply select "Disable" in the combo box!!
CPU shares may increase slightly when using the HDD Read/Write Usage feature.
In this case, you can set "Stop" in the options.
Autorun checks are displayed on the tray icon at the start of the window.
Log files are typically created with the Result.log file in the program location path.
Open as Notepad when "View" is selected in Options.
You can see CPU, RAM usage, share, ping delay, and disconnected status.
As shown below, the process usage is coming out, and this operation itself consumes a lot of CPU.;;
Due to heavy CPU usage, scanning and filtering all processes at slow speeds is a load.
So I set this to work only once every 30 seconds.
For example, if you set up 80% CPU monitoring, you log the load-bearing process at the first 80% point.
Do the same after 30 seconds. (Once every 30 seconds)
Download
2 engines detected this file
SHA-256 : 4bf1960f4dd907abcd836e47d0039825981d21eec3679d83993154c5e1ff5d98
File name : SimpleMonitor.zip
File size :711.42 KB
Last analysis : 2017-08-28 00:04:27 UTC


댓글 없음:
댓글 쓰기